HR Metrics: A Strategic Guide to Measuring Workforce Performance
HR metrics translate workforce performance into measurable, actionable numbers organized into five outcome-based pillars. This guide shows how to build a disciplined 15-25 metric stack with proper governance, and how agentic intelligence shifts metrics from static monthly reports into real-time signals that flag risk before it hits the bottom line.
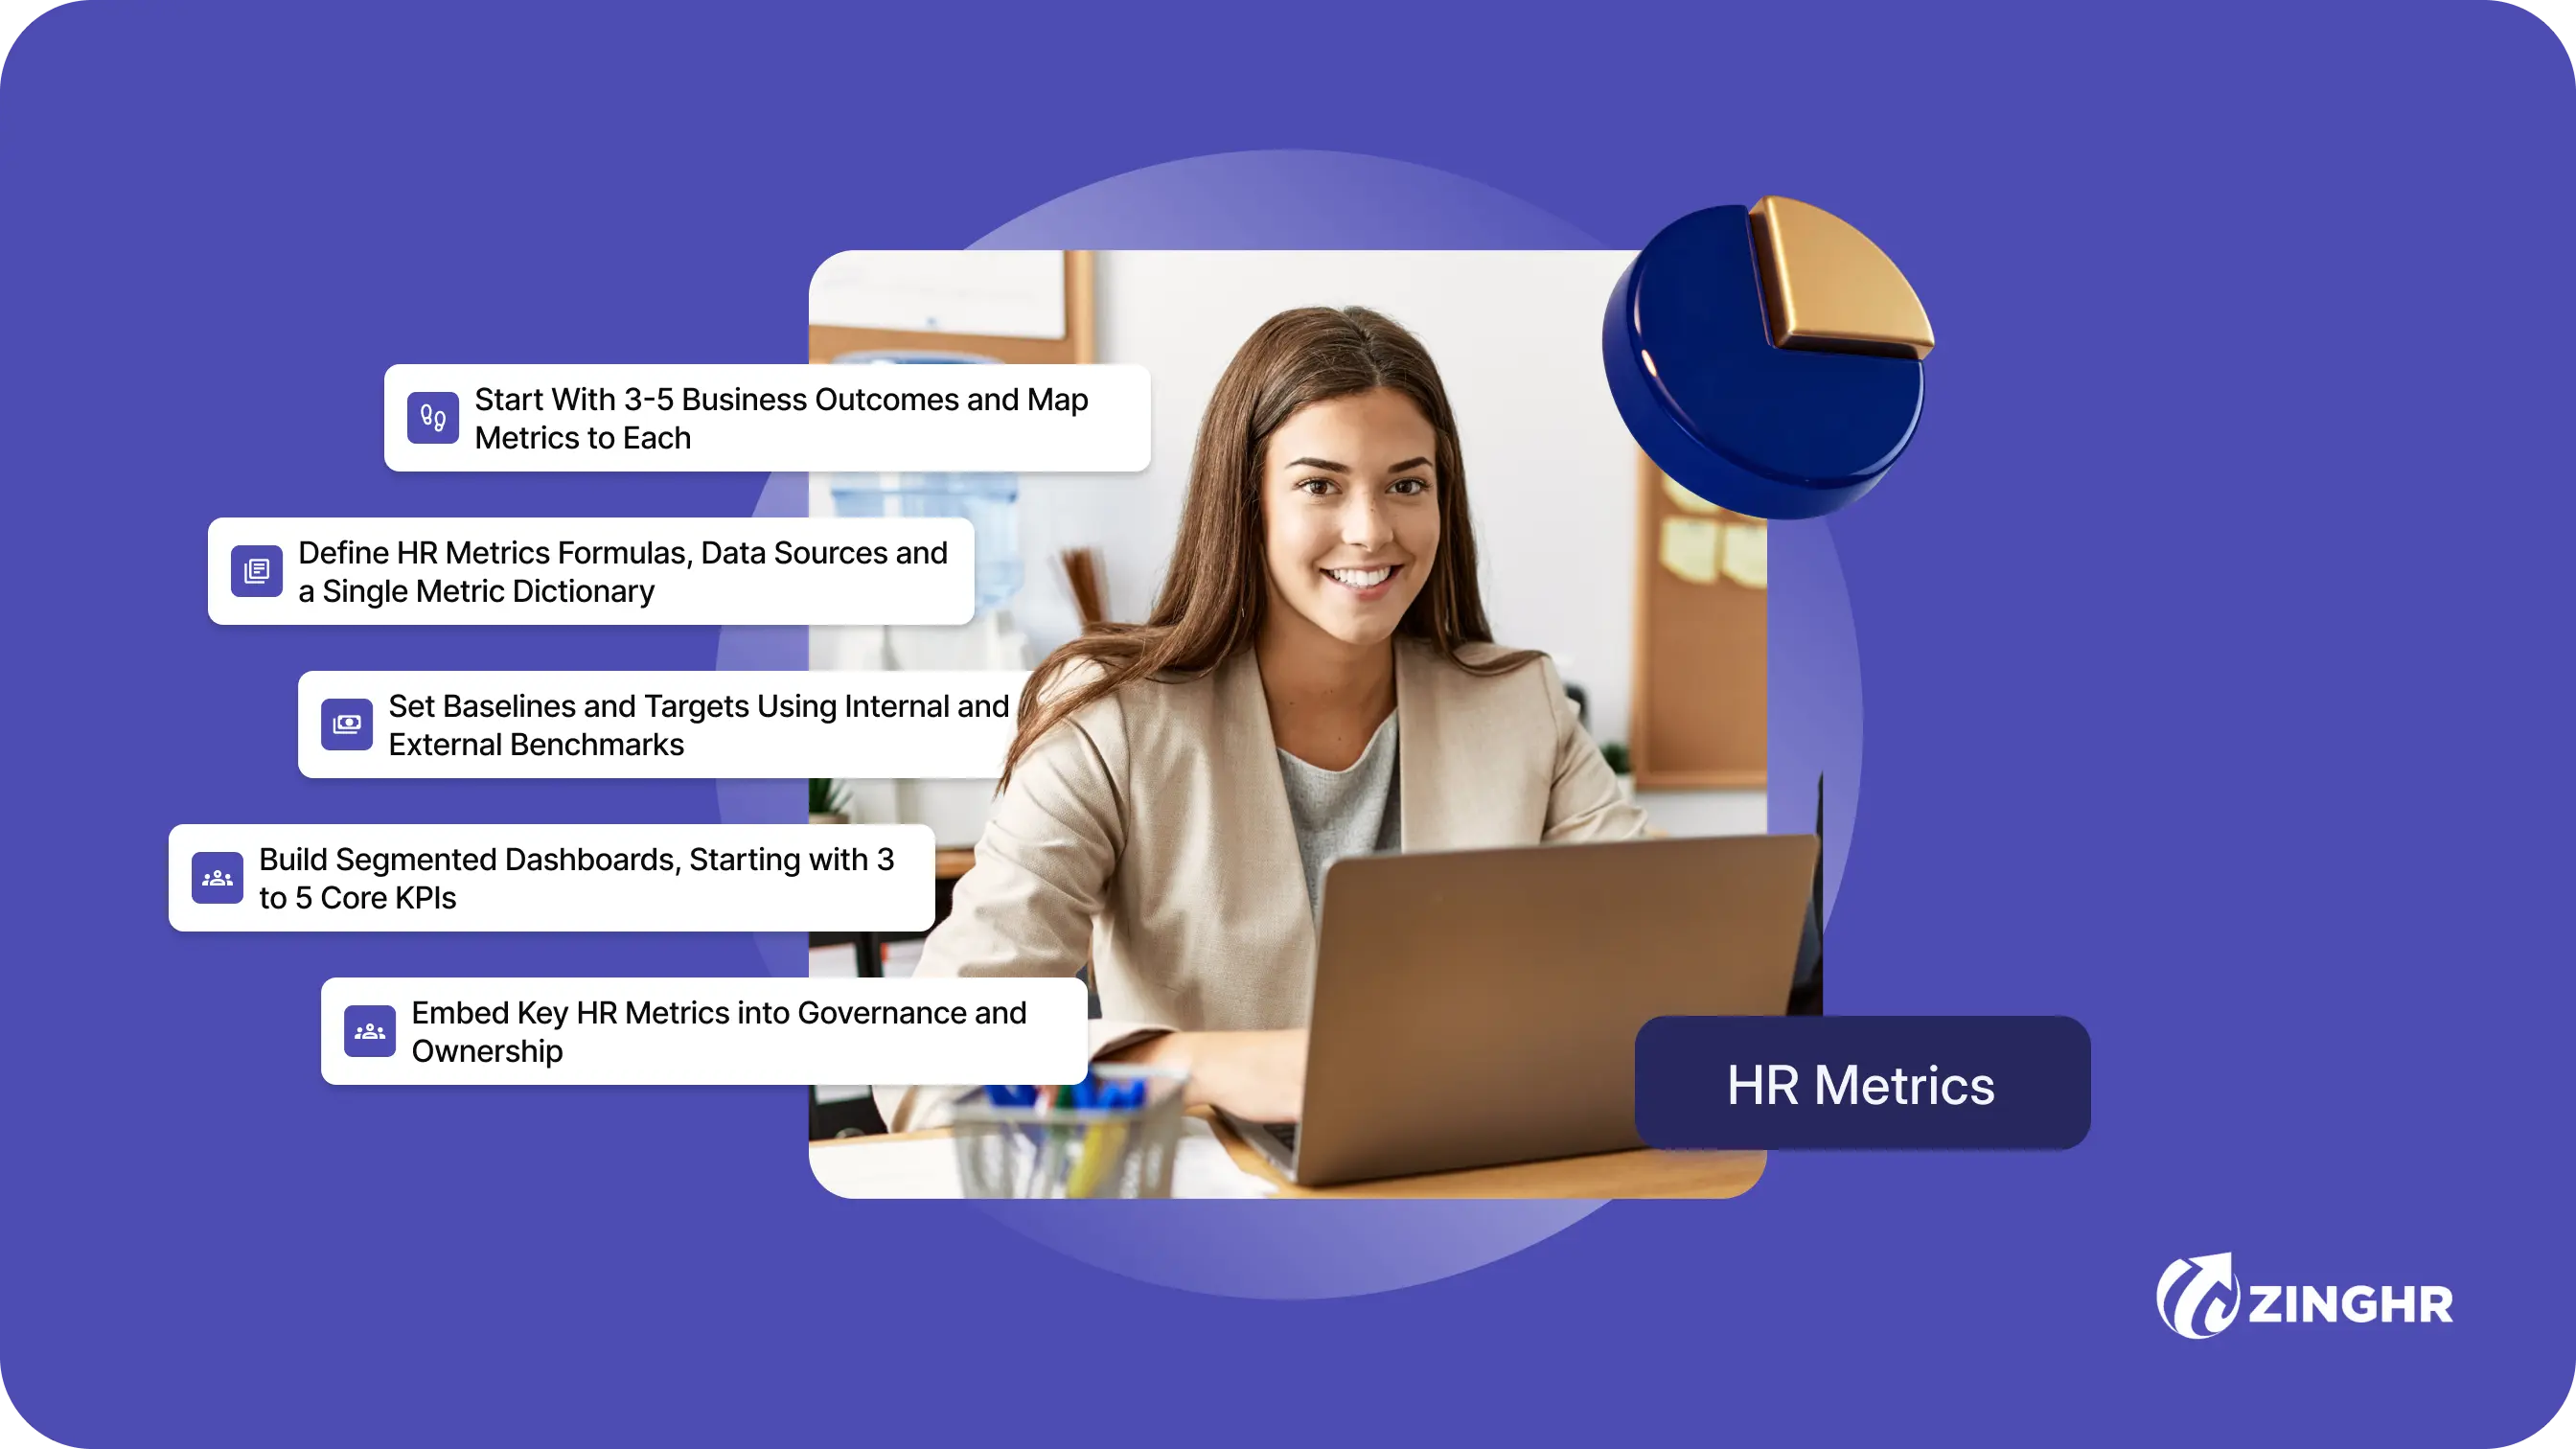
Table of contents
One unstitched HR platform to manage your entire workforce, from Hire to Re-Hire.
Talent Management solutions built for growing and exceptional people
Built-in compliance tools that update with changing regulations
Automated payroll, attendance, and leave management
Insights that help HR leaders make faster, better decisions

Key Takeaways
- HR metrics quantify how well HR drives business outcomes. They span hiring and retention through to cost and compliance.
- At scale (1,000+ employees), static dashboards and siloed systems leave metrics as lagging indicators when they should drive decisions.
- Organize metrics into five outcome-based pillars: Growth, Retention, Productivity, Cost/Efficiency, and Risk/Compliance. Track 15 to 25 high-impact metrics and keep the count disciplined.
- A disciplined strategy runs outcome → metric → data source → dashboard → governance, with formulas and benchmarks defined once.
- Agentic intelligence turns metrics from static reports into live signals. They detect anomalies and trigger workflows in real time.
For a CHRO, the boardroom question has changed. The old ask was "how many people did we hire last quarter?" Today, it is "what business outcome did our workforce deliver?" and most HR reporting struggles to answer that in real time.
Your CFO wants the headcount-vs-attrition trend before the Monday review. Pulling it means stitching together four systems, each defining turnover a little differently.
The stakes have climbed sharply in two years. India's Digital Personal Data Protection Act (DPDPA) raised the bar on how organisations collect and use employee data. Pay-equity scrutiny and ESG disclosure expectations are tightening. Post-pandemic voluntary turnover is still running hot in knowledge-heavy and frontline workforces alike. Boards and CXOs now treat workforce intelligence as a governance obligation.
This guide covers:
- A working definition and a five-pillar framework with formulas and benchmarks
- A step-by-step strategy for building your metric stack
- The move from static reporting to agentic intelligence
- The compliance metrics your board must watch
HR Metrics Meaning and How They Differ from HR KPIs
HR metrics are quantifiable measures used to track and assess the efficiency and impact of HR practices and policies on organisational performance. They span recruitment and retention through to cost and compliance, translating how people work into numbers you can act on.
HR Metrics vs. HR KPIs vs. HR Analytics
These three get used interchangeably, and that is where confusion starts. The clean distinction:
- Metrics are the measures themselves; every number you can capture.
- KPIs are the prioritised subset tied to specific targets and outcomes. Every KPI is a metric, though only some metrics earn KPI status.
- HR analytics is the interpretation layer. It models and correlates data to explain why a metric moved and what to do next.
You need all three, and you lead with outcomes ahead of the longest possible list.
Why HR Metrics Are the Data Backbone of Modern HCM
Metrics turn judgement calls into measurable hypotheses. "Attrition feels high in the western region" becomes a testable claim with a number, a segment, and a trend line. That is the shift organisations need: moving from opinion to evidence, then from evidence to prediction.
Get your metric foundation right and every layer above it, including predictive and agentic capability, has something solid to stand on.
Why Generic HR Metrics Approaches Fall Short at Scale
The advice that works for a 200-person company breaks at 5,000. Your HRIS and payroll systems each hold a slice of the truth, and each computes turnover on a slightly different basis. The result is what most CHROs know too well: multiple versions of the same number, and one board-level truth that stays out of reach for the Monday review.
1. Lagging Dashboards vs. Real-Time Decision-Making
A static monthly report tells you about a problem after it has already cost you money.
By the time an attrition spike in one business unit shows up in the deck, the high performers have already resigned. The replacement cost is locked in. Companies need leading indicators: signals that flag risk while there is still time to intervene.
2. Metric Overload: Measuring Everything, Learning Nothing
The opposite failure is just as common. Teams track 100+ KPIs and build dashboards that stay unread. They mistake activity for insight. Even large organisations should keep a disciplined core of high-impact metrics instead of drowning in overlapping ones.
For employers with 1,000+ employees, 15 to 25 metrics that map to outcomes is the right target. A wall of numbers only hides the three that matter.
The 5 Pillars of HR Metrics (with Formulas and Examples)
Organise the types of HR metrics by the business outcome they protect. The five pillars:
- Growth: Protects your ability to staff the business fast enough to hit a plan.
- Retention: Protects institutional knowledge and revenue continuity.
- Productivity: Connects workforce size to business output.
- Cost/Efficiency: The numbers your CFO already speaks.
- Risk/Compliance: The pillar your board watches closest.
Track a disciplined handful in each and you land on 15 to 25 high-impact metrics without the clutter.
A quick reference for measuring hiring efficiency, cost, speed and offer success.
Pillar 2: Retention and Culture
Retention metrics are leading indicators of business risk. In knowledge-heavy and frontline workforces, a resignation cluster hits revenue directly. The most abused number here is turnover, because most reports blend voluntary and involuntary departures into one figure.
Separate them:
- A rising voluntary turnover rate warns you about pay and stalled career paths.
- Involuntary turnover tells a different story about performance or restructuring.
Pair the headline rate with new-hire 90-day retention and average tenure, then layer in employee engagement and eNPS.
A quick reference for measuring workforce stability, employee retention, turnover and average tenure.
Pillar 3: Productivity and Performance
Productivity metrics connect your workforce to output. Revenue per employee is the go-to measure for large organisations. Goal completion rate and 9-box segmentation add talent depth.
Watched by business unit instead of in aggregate, revenue per employee shows where productivity is real and where headcount quietly outruns results.
For a deeper look at how performance data feeds these numbers, see our guide to performance management in HRM.
A quick reference for measuring employee productivity, goal achievement and the return on training investment.
Pillar 4: Cost and Efficiency
HR cost per employee and the HR expense factor tell you whether you are under-investing or overspending. Add HR software participation rate to gauge digital adoption.
The HR-to-employee ratio traditionally runs around 1 to 1.5 HR staff per 100 employees; tech-enabled organisations run leaner, with higher HR tech spend.
A quick reference for tracking HR spending, workforce ratios and HR technology adoption.
See also: how to track payroll metrics alongside your HR cost data.
Pillar 5: Risk, Compliance, and Diversity
Track diversity percentage by level and the pay equity ratio. Add POSH training completion and absenteeism rate.
Then watch the statutory compliance rate tied to your payroll and statutory compliance obligations. Diversity %, watched by seniority level, exposes whether representation thins as you move up the org chart.
A quick reference for tracking diversity, pay equity, POSH training, absenteeism and statutory compliance.
How to Design an HR Metrics Strategy (Step-by-Step)
A pile of HR metrics falls short of a strategy. The method that works runs in one direction: outcome → metric → data source → dashboard → governance. Skip a step and you build dashboards your leaders ignore.
Step 1: Start With 3-5 Business Outcomes and Map Metrics to Each
Name the outcomes first, then map three or four key HR metrics to each. Examples:
- Reduce voluntary sales attrition by 5% → voluntary turnover rate, engagement score, flight-risk scores.
- Improve leadership diversity → diversity % by seniority level, promotion rate by gender.
- Cut time to fill for critical roles → time to fill, offer acceptance rate, cost per hire.
Priority drives selection. A growth focus pulls time to fill and offer acceptance forward. A retention focus leads with voluntary turnover and engagement.
Step 2: Define HR Metrics Formulas, Data Sources and a Single Metric Dictionary
This is where "multiple versions of turnover" dies. For each metric:
- Write one formula and make it the only version.
- Name the system of record (HRIS, payroll, LMS).
- Publish both as a shared dictionary visible to every team that touches HR data.
When everyone computes a number the same way, the Monday review stops arguing about definitions.
Step 3: Set Baselines and Targets Using Internal and External Benchmarks
Use your own historical data as the primary baseline, then calibrate against external references like the HR-to-employee ratio and HR expense factor. Internal benchmarking beats generic industry averages, because a market-wide time-to-fill number says little about your specific roles and regions.
Step 4: Build Segmented Dashboards, Starting with 3 to 5 Core KPIs
Start narrow. Put three to five core KPIs on the first HR analytics dashboard, then slice each by:
- Business unit and location
- Tenure and role family
- Gender representation
Hotspots hide in the aggregate. A flat company-wide attrition number can mask one plant or one manager driving most of the damage.
Step 5: Embed Key HR Metrics into Governance and Ownership
Assign each type of HR metric an owner:
- TA owns time to fill and cost per hire.
- L&D owns training ROI.
- HR ops owns statutory compliance rate and absenteeism.
Wire the core set into monthly business reviews and leadership OKRs. Review the full metric stack once a year. Retire vanity numbers and shift from measuring activity to measuring impact.
Compliance-Driven HR Metrics Every CXO Must Watch
Compliance HR metrics examples turn into fines and personal liability the moment they slip. Tie each metric to its regulatory driver, and it shifts from HR housekeeping to risk management.
1. India: Statutory, Wage, and DPDPA Obligations
Indian employers carry a dense statutory load. Key HR metrics to track:
- EPF/ESI compliance rate and gratuity accuracy against the Payment of Wages Act and EPF rules.
- Payroll error rate against ESI obligations.
- Overtime percentage and leave utilisation for Factories Act and state Shops and Establishments exposure.
- POSH training completion at 100%, with incident resolution time tracked separately.
India's DPDPA makes employee data a governed asset. Measure it by tracking HR data-access violations, percentage of HR systems on role-based access, and data-subject request response time.
For a full compliance checklist, see our guide to labour law compliance in India.
2. Global: GDPR, Pay Equity, and ESG Disclosure (ISO 30414)
Multinationals operating across jurisdictions inherit a second layer of rules. Key tracking obligations:
- GDPR: Anonymisation rate and purpose-limitation audit score for jurisdictions with stricter privacy requirements.
- Pay equity: Pay equity ratios and hiring and promotion rates by protected class; test for adverse impact in selection processes.
- ESG: Human capital metrics mapped to ISO 30414, the human capital disclosure standard, to give your board a defensible structure for workforce numbers in the annual report.
HR compliance metrics by regulatory area
From Static Reporting to Agentic HR Intelligence: How ZingHR Approaches HR Metrics
Everything above assumes a person pulls the report and acts on what they find. That is the bottleneck. A human usually reads a monthly dashboard after the window to intervene has closed.
ZingHR closes that gap by placing your metrics inside a strategic command centre rather than a static reporting tool.
1. Turning Metrics into Living Signals
Agentic intelligence watches your metrics every day instead of once a month. When voluntary attrition spikes in one business unit, or absenteeism climbs at a single plant, the system spots the anomaly the moment it forms. Then it acts, triggering workflows automatically:
- An engagement pulse sent to the affected team.
- A coaching nudge to the manager.
- A flag raised to the HRBP before the resignation lands.
Predictive attrition and flight-risk models score risk before a resignation lands, so you intervene while your high performers are still in their seats. The metric stops being a rear-view mirror and becomes an early-warning system.
2. Unified HCM, Compliance-by-Design, and Board-Level Intelligence
A single command centre kills the "multiple versions of turnover" problem at the source. One data model and one definition per metric give you a single truth for the Monday review. Because it is a unified HCM platform, compliance is engineered in from the start:
- Role-based access guards sensitive metrics like compensation and diversity, satisfying DPDPA and GDPR by design.
- Intelligence surfaces at the right altitude, giving your CHRO and CFO real-time workforce signals instead of stale exports.
- Organisations move from Stage 3 reporting to Stage 4 predictive, agentic capability.
Industry Use Cases: What Organisations Measure
The framework earns its keep in specific industries. Here is what disciplined metric stacks look like where the stakes run highest.
1. BFSI/NBFC: Predictive Attrition to Protect Sales Revenue
Banks and NBFCs treat sales attrition as revenue attrition. When a relationship manager leaves, the book of business tends to leave with them. The metric stack here leads with:
- Predictive turnover risk scores by salesperson and territory.
- Engagement drivers behind voluntary churn.
- Revenue impact per attrition event, tracked by business unit.
One of India's largest NBFCs follows a clear pattern: it catches flight risk early in the sales force and acts on the drivers, cutting voluntary turnover before it dents the top line.
2. Manufacturing: Absenteeism and Safety at High-Risk Plants
On the shop floor, attendance and safety are the numbers that matter most. The core metric stack:
- Absenteeism rate and overtime percentage, tracked by plant.
- LTIFR (lost time injury frequency rate) by location.
- Engagement scores cross-referenced with safety incidents to find where risk concentrates.
Target high-risk plants directly instead of running a blanket policy. Both absenteeism and incidents fall where they actually occur.
3. Organisation-Wide: Diversity and Pay Equity for Global Policy Compliance
For a multinational, diversity and pay equity carry legal weight as policy obligations. The metrics that matter:
- Diversity % by seniority level, not just company-wide.
- Promotion rates by gender, tracked year on year.
- Pay equity ratio against market rate, at each seniority band.
Watched by seniority, these show whether representation and fair pay hold up as people move up the organisation. That is exactly the evidence a global board and its regulators expect to see.
From Metrics to Management Discipline
Metrics matter when they are organised around outcomes and defined once so everyone agrees. Make them real-time, and you can act before the cost lands. Track a disciplined 15 to 25 across the five pillars, wire them to clear owners and governance, and you have built something your board can actually use.
For boards and CXOs, HR metrics work as early-warning signals of business risk and levers of GHROWTH. The organisations pulling ahead have stopped reading their metrics after the fact and started acting on them as they move. Agentic intelligence with Ghrowth.ai makes that shift real, turning your numbers into interventions that protect both revenue and compliance in one motion.
Book a demo to see how ZingHR's agentic intelligence HCM platform can support your HR metrics strategy.
Frequently asked questions (FAQs)
Start with five that map directly to business outcomes: 1. Voluntary and involuntary turnover rates 2. Engagement score or eNPS 3. Time to fill 4. Revenue per employee 5. One core compliance metric, such as statutory compliance rate Get these clean and consistently defined first. Expand into predictive metrics like flight-risk scores once the foundation holds.
Review core operational metrics monthly in business reviews. Check strategic KPIs quarterly against targets. Audit the full metric stack once a year to retire vanity numbers. With agentic monitoring, critical signals like an attrition spike or a compliance breach show up in real time, so you catch what matters most between review cycles.
Metrics are every quantifiable measure you can capture. KPIs are the strategically prioritised subset tied to specific targets and business outcomes. Every KPI is a metric, though only some metrics rise to KPI status. You track many metrics, and you manage the business against a focused set of KPIs.
Six carry most of the weight: 1. Turnover rate: (departures ÷ average employees) × 100. 2. Time to fill: total days from posting to offer acceptance ÷ hires. 3. Cost per hire: (internal + external recruiting costs) ÷ hires. 4. Revenue per employee: total revenue ÷ total employees. 5. Average headcount: (starting + ending headcount) ÷ 2. 6. HR expense factor: total HR expenses ÷ total operating expenses × 100.
Aim for a disciplined 15 to 25 high-impact metrics spread across the five pillars, well short of the 100-plus that clog most dashboards. More metrics rarely add insight. A tight, outcome-mapped stack keeps the three numbers that truly matter visible above the noise.
It shifts metrics from lagging reports to real-time signals. A human reads a monthly dashboard after the damage is done. Agentic intelligence: 1. Monitors metrics continuously and detects anomalies as they form 2. Predicts risk like impending attrition before a resignation is submitted 3.Triggers interventions such as engagement pulses or manager coaching automatically.
What to do next?
See ZingHR in Action
Join the 1,200+ enterprises that have replaced fragmented HR with one intelligent, future-ready platform. See ZingHR in 30 minutes.
Build the Organization You Want
Great HR drives retention, capability, and culture. ZingHR takes care of the operational layer so your people team owns the strategy.

Elevating Impact.
Defining Destiny
See how ZingHR's AI-powered Hire-to-ReHire platform frees your CPO to lead with purpose and deliver the outcomes your Board is watching for


ZingHR is the AI-powered Hire-to-ReHire platform built for one purpose to remove every transactional layer of HR from your organisation, permanently.