How to Get Workforce Forecasting Right
Spreadsheet forecasts go stale the moment strategy shifts. Five steps to build a workforce plan your CFO won't rebuild and seven tool capabilities to evaluate before you buy.
Table of contents
One unstitched HR platform to manage your entire workforce, from Hire to Re-Hire.
Talent Management solutions built for growing and exceptional people
Built-in compliance tools that update with changing regulations
Automated payroll, attendance, and leave management
Insights that help HR leaders make faster, better decisions

Key Takeaways
- Lock five shared financial inputs with Finance before anyone opens a model. Most workforce forecasting failures start here.
- Derive headcount from business drivers (volume, transactions, revenue), not last year’s number plus a growth percentage.
- Decompose attrition by grade, tenure, and geography. A blended rate hides where the risk actually sits.
- Run base, optimistic, and conservative scenarios with pre-approved decision triggers attached to named owners.
- Seven tool capabilities map directly to these process steps. Each section includes specific questions to ask in a vendor demo.
- Best-in-class targets: ≤5% headcount variance, ≤8% cost variance at the quarterly horizon.
Your CFO wants next year’s headcount plan by Friday. The board wants a skills-readiness view by month-end. Meanwhile, operations leaders are quietly burning through the contractor budget because the hiring plan “approved” in March is already obsolete. This is the working reality for CHROs at 1,000+ employee enterprises, and the reason workforce forecasting has become a quarterly governance issue.
The pressure is structural. Macro volatility, evolving labour regulations, and persistent skills shortages in digital and clinical roles have changed the operating context. Boards now expect real-time workforce intelligence. A December 2025 Gartner survey of 197 CxOs found that only 27% of executives have a comprehensive AI strategy, and a mere 20% believe their workforce is truly AI-ready. Despite this, most enterprise forecasts are still built in spreadsheets that go stale on approval day.
This article walks through a practical five-step forecasting process that enterprise HR-Finance teams use. It also translates that process into seven concrete tool capabilities to test in your next vendor evaluation.
The 5-Step Workforce Forecasting Process
Workforce forecasting failures are typically an alignment problem: HR, Finance, and the business are solving three different problems and calling them the same plan. These five steps fix that by making assumptions shared, visible, and revisable before a single number gets modelled.
Step 1: Lock Assumptions with Finance Before You Model Anything
The most common workforce forecasting failure: HR builds a plan, Finance rebuilds it, and by the time both versions reach the CEO’s desk, nobody trusts either. The fix is to agree on shared financial assumptions before anyone opens a model.
What to produce: A short, written set of workforce assumptions tied directly to the business plan.
If the strategy says “grow Tier-2 retail footprint by 40%,” the forecast needs an explicit assumption about store-level staffing ratios.
If the strategy says “shift 30% of service to AI-assisted resolution,” the forecast needs an automation displacement curve and a reskilling pipeline with dates.
The alignment checklist. Before modelling starts, HR and Finance jointly agree on:
- Revenue per FTE by business unit, with three-year trend and forward target.
- Contribution margin per role family for revenue-generating functions.
- Cost-per-hire ceilings by grade, including agency fees and referral economics.
- Fully-loaded cost per FTE by location, with every statutory component modelled (PF, ESI, gratuity, bonus in India; equivalent obligations for other geographies).
- Location strategy parameters: Tier-1 vs. Tier-2 mix, hybrid vs. on-site split, GCC vs. outsourced share.
Lock and version these five inputs. Without them, every scenario discussion becomes a debate about assumptions rather than decisions.
Common failure mode: HR teams typically submit the annual workforce plan in October or November for the upcoming financial year. When Finance reviews the numbers, they often uncover gaps that make the plan difficult to use as-is. FTE definitions may not align with the general ledger, workforce costs can be understated because statutory components have been estimated rather than calculated, and location allocations may not reconcile with facility and IT budgets. Together, these issues can create a 12-18% variance in projected people costs.
As a result, Finance spends valuable time reworking the plan to bring it in line with budget assumptions and reporting requirements. By the time the new business year begins in January, the organisation is often operating against a workforce plan rebuilt by Finance, while HR's original plan has effectively been replaced.
.webp)
Step 2: Build a Clean Data Foundation
Inputs are typically fragmented across HRMS, ATS, payroll, and time-and-attendance. Until data is unified and definitions are consistent, every workforce forecasting cycle is a reconciliation exercise.
Required Internal Data (3-5 years of clean history)
- Monthly headcount snapshots by role, grade, location, cost centre, and employment type. Year-end totals hide seasonal patterns.
- Joiner-mover-leaver data with reason codes so attrition decomposes into voluntary, involuntary, retirement, and internal movement.
- Absenteeism and overtime patterns, especially in shift-based industries (Manufacturing, BFSI ops, Healthcare, QSR).
- Productivity metrics tied to business drivers: tickets per agent, claims per processor, revenue per relationship manager.
- Performance and potential ratings to segment critical talent and quantify bench strength.
Required External Data
- Wage inflation by location and role family, from compensation surveys.
- Time-to-fill benchmarks for critical roles (digital, clinical, specialised engineering).
- Industry growth or contraction signals tied to your demand drivers.
- Seasonality patterns: retail festive cycles, BFSI year-end peaks, tax-season ramps.
Pro tip: Publish a one-page data dictionary that locks definitions for FTE, contingent worker, contractor, billable vs. non-billable, and active vs. on-leave. Every system feeding the forecast maps to that dictionary. Refresh monthly (weekly for high-velocity workforces in QSR, Retail, BPO, frontline Healthcare).
Step 3: Forecast Demand by Role, Skill, and Work Volume
Demand forecasting answers: how much work does the business expect, and how many people (with which skills) does that require? Derive headcount from business drivers, not from last year’s number plus a growth percentage.
3a. How to translate drivers into headcount
Start with the business metric, then work backwards to FTE.
A contact centre plans against contact volume ÷ handle time ÷ shrinkage. A BFSI team plans against transaction volume and SLA targets. A QSR brand plans against same-store sales and labour-to-sales ratios by store format.
Worked example (BFSI back-office):
Current volume: 240,000 cases/month
Handling time: 22 min/case
Productive hours: 6.5/day × 22 days = 143 hrs/FTE/month
Required productive FTE: 240,000 × (22/60) ÷ 143 ≈ 615
Add 18% shrinkage (leave, training, breaks): 615 ÷ 0.82 ≈ 750 FTE on rolls.
Next year: +18% volume, 6% productivity gain from automation = ~835 FTE needed, not 885 from flat extrapolation. That 50-FTE delta is real budget.
3b. Add skills tagging
A “data analyst” headcount line tells you nothing about whether you need SQL, Python, or cloud-specific analytics.
Tag demand at two levels: role level (for cost accounting) and skill level with proficiency bands (for talent strategy). This answers what your CIO actually wants to know: do we have the right capabilities in the right places, or are we hiring around a gap we could close internally?
Step 4: Forecast Supply Using Attrition, Mobility, and Hiring Data
Given today’s workforce and realistic assumptions about who will leave, move, retire, or be hired, what capacity will you actually have when Step 3’s demand lands?
Decompose Attrition
A blended rate hides the risk. A 22% rate in sales operations is likely 8% in top-quartile performers, 35% in the bottom quartile, and 45% in first-year hires. Decompose by grade, role family, tenure, and geography.
Layer in leading indicators: engagement scores, eNPS trends, internal mobility blockages.
Quick test: If critical-skill attrition runs at 28% and external time-to-fill for that role is 90 days, your steady-state vacancy rate sits at roughly 7%. Build that into the demand-supply gap from day one rather than treating it as a TA execution problem.
Model Retirements and Internal Mobility
You know who turns 58 or 60 in the next 36 months. Build a retirement curve by function and grade.
For internal mobility, quantify your internal fill ratio (percentage of roles filled by internal candidates) by grade and function. Most enterprises run 25-55%. That ratio is the single biggest lever between an expensive external hiring plan and a credible internal mobility narrative for the Board.
Capture External Hiring and Contingent Capacity
Model time-to-fill by role and location, offer acceptance rates by source, campus intake by college tier, and named vendor capacity.
For 1,000+ employee enterprises, the contingent workforce is often 15-30% of effective capacity. Treat it as a first-class forecast input with its own cost model and compliance constraints.
Suggested read: The Growing Adoption of HR Software in India: 2026 Report
Step 5: Run Scenarios and Set Governance Cadence
A single-plan forecast is a bet. Scenarios turn it into a decision system.
Pick two or three uncertainties that materially move the plan. For most enterprises in 2025-2026: revenue growth pace, AI adoption speed, and a regulatory variable (e.g., Labour Code rollout timing).
Build base, optimistic, and conservative cases using the same five Finance metrics from Step 1.
Additionally, attach decision triggers with named owners. Examples:
- “If the projected critical-engineer gap exceeds 40 FTE at six months, activate campus pipeline plus vendor contracting. Owner: CHRO and CFO jointly.”
- “If revenue tracks 8% below plan for two consecutive quarters, freeze non-critical backfills and absorb attrition. Owner: BU heads.”
You should also set the governance rhythm, like monthly HR-Finance-BU reviews of forecast vs. actuals and quarterly re-baselining aligned to Finance’s rolling forecast. Four KPIs for the dashboard:
- Forecast accuracy on headcount and cost (target: ≤5% and ≤8% respectively at the quarterly horizon).
- Vacancy days for critical roles.
- Overtime and contractor ratios vs. plan.
- Hiring lead-time vs. scenario trigger thresholds.
7 Tool Capabilities to Evaluate in Your Next Workforce Forecasting Platform
Excel breaks at enterprise scale in three places: data consolidation becomes a weekly drag, scenario versioning collapses, and recalibration against actuals stops happening.
While the process itself is straightforward, execution often breaks down when teams rely on disconnected systems and spreadsheets. The following capabilities support each stage of the workforce forecasting cycle and help organisations maintain accuracy and agility at scale.
Each capability below solves a specific pain point from the five steps above. The “Questions for the demo” are designed to separate real capability from slideware.
1. Unified Data Model and Integrations
Solves: Step 2 (fragmented data, inconsistent definitions, manual reconciliation).
Questions for the demo:
- Can we configure role, grade, skill, location, and cost-centre hierarchies to match our org structure?
- Does the platform validate data against a single dictionary with audit trails?
- Are payroll, ATS, time-and-attendance, and performance integrated natively or through tested connectors?
Enterprise HR platforms like ZingHR consolidate employee master, attendance, performance, and payroll on one foundation.
In India, where statutory complexity makes fully-loaded cost per FTE difficult to model across disconnected systems, a unified data layer means the workforce forecasting model inherits the same definitions used in operational reporting.
2. Driver-Based Demand Modelling
Solves: Step 3 (tools that only extrapolate historical headcount).
Questions for the demo:
- Can we input our own demand drivers (tickets, transactions, revenue, batches, beds, stores) and derive headcount from them?
- Does it support weekly through quarterly time buckets and role-level ramp curves?
- Model a 3x seasonal surge in a Tier-2 city across permanent and contingent staff, with the cost view in parallel. Can it do that live?
3. Supply, Skills, and Attrition Modelling
Solves: Step 4 (no attrition curves, no skills inventory, no internal redeployment data).
Questions for the demo:
- Can we build attrition curves segmented by grade, tenure, and geography, and override them with our own assumptions?
- Is there a skills inventory with proficiency tagging that connects to learning and internal mobility?
- Can we see how much of a projected gap closes through internal fills vs. external hiring?
ZingHR’s performance, learning, and skills data feeds the supply side of workforce forecasting directly. The connected skills inventory and internal talent marketplace lets enterprises model internal fill rates by skill and grade.
4. Scenario Planning and What-If Modelling
Solves: Step 5 (scenarios trapped in offline spreadsheets, there’s no audit trail).
Questions for the demo:
- Can we view base, optimistic, and conservative scenarios side by side with the same financial metrics?
- Are assumptions (revenue, productivity, attrition, hiring freeze, location mix) toggleable per scenario?
- Does the platform version-track scenarios with approval workflows?
5. HR-Finance Collaboration Workflows
Solves: Steps 1 and 5 (HR and Finance working on different versions, stale budget submissions).
Questions for the demo:
- Does Finance see cost views and HR see headcount views from the same underlying data?
- Are there approval workflows, change logs, and inline commenting?
- Can approved workforce forecasting plans flow into our ERP or FP&A platform via API without re-keying?
Suggested Read: How to Create Successful Performance Management Strategies
6. AI-Driven Recalibration and Alerts
Solves: Continuous improvement (forecasts going stale, attrition spikes visible only after the damage).
Questions for the demo:
- Does the AI update forecasts between manual review cycles based on leading indicators?
- Does it flag threshold breaches with specific cohort and geography detail?
- Are recommendations explainable enough for audit under DPDP and emerging AI regulation?
ZingHR’s Intelligence Hub identifies the cohort and geography driving a spike, projects the capacity gap, and recommends a pre-emptive move with cost and timeline attached.
7. Compliance, Localisation, and Enterprise Controls
Solves: Cost accuracy (statutory components missing from the cost model, weak data residency).
Questions for the demo:
- Are PF, ESI, gratuity, bonus, and professional tax embedded in the cost model or bolted on as flat percentages?
- Does it support multi-country payroll structures?
- Are data residency, encryption, and audit logs production-grade?
Why this matters: A forecast that ignores statutory components typically misses fully-loaded cost by 15-25%. At a 5,000-FTE enterprise, that is a credibility-ending error. India payroll and statutory compliance built into the platform is what makes the number trustworthy at Board level.
.webp)
Maturity Audit and Vendor Evaluation
Run this before any vendor conversation. Each answer points to the workforce forecasting capability that closes the gap:
- Forecasting against business drivers, or last year plus a growth %? → Capability 2.
- Does Finance trust your numbers without rebuilding them? → Capabilities 1 and 5.
- Can you produce a credible scenario in hours? → Capability 4.
- Skills-level visibility into supply and internal mobility? → Capability 3.
- Forecast recalibrated continuously, or refreshed annually? → Capability 6.
Hidden Costs to Watch
- Implementation and change management: Typically 60-70% of total programme effort.
- Skills taxonomy maintenance: Name an owner before you buy. Unowned taxonomies go stale in two quarters.
- Integration engineering: Test live API calls for HRMS, ATS, payroll, ERP, and BI connectors.
- Data governance: DPDP and GDPR require consent, retention, and explainability controls built before go-live.
- Vendor maturity: Reference customers at 1,000+ employees in regulated industries matter more than logo slides.
Score shortlisted vendors 1-5 on the seven capabilities plus these five dimensions, weighted by your maturity gaps. Strategic workforce planning case studies from comparable enterprises are worth pulling at this stage to pressure-test what “good” looks like at your scale.
How ZingHR Approaches Workforce Forecasting
ZingHR is an HCM platform built for Boards and CXOs at 1,000+ employee enterprises. The workforce forecasting use case sits inside a unified HCM foundation: the data feeding the forecast (employee master, attendance, performance, learning, skills, payroll) is the same data running the operational HR cycle.
Three things stand out against the seven capabilities. First, native India payroll with every statutory component modelled means fully-loaded cost per FTE is accurate.
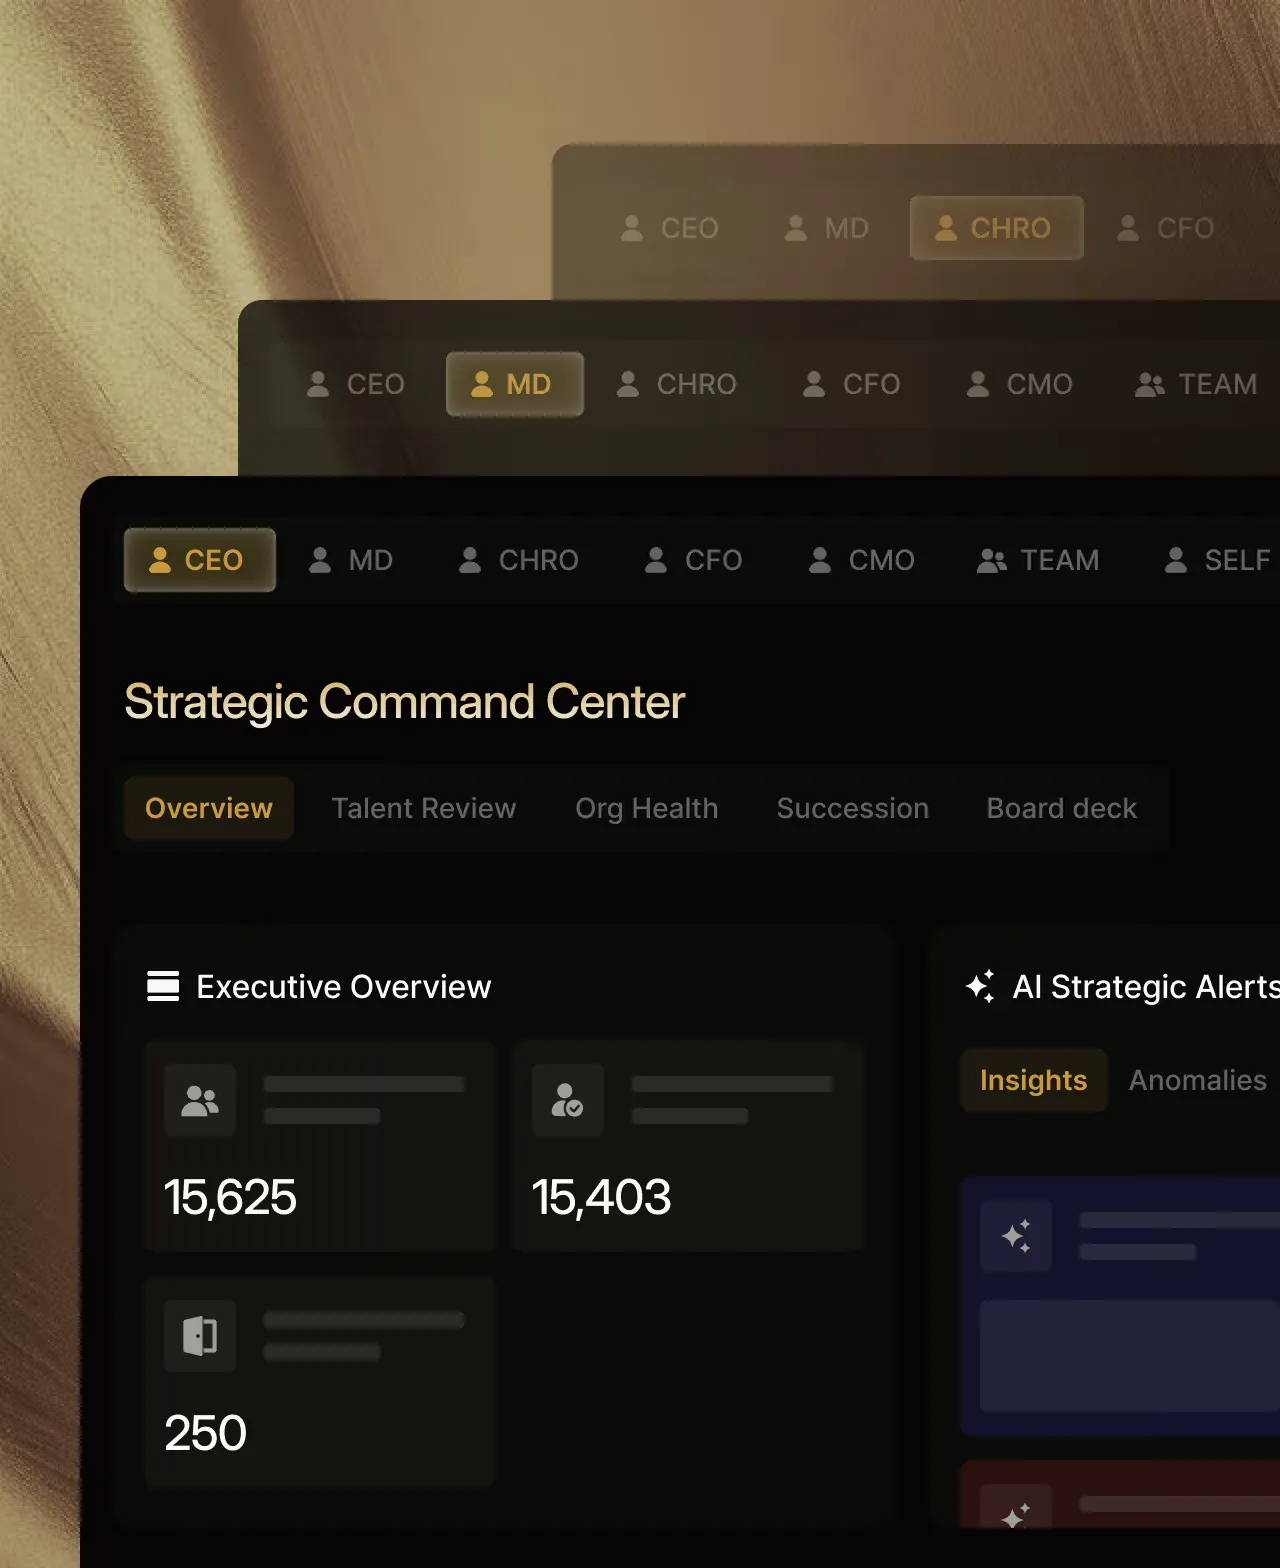
Second, the intelligence layer with Ghrowth.ai recalibrates against actuals continuously, flags attrition hotspots and demand surges before they become problems, and recommends actions with cost and timing attached.
Third, CHRO, CFO, CIO, and CEO views run from one data set with identical lineage and audit trail.
Run Workforce Forecasts at Scale
Workforce forecasting requires a disciplined process and a platform that can run it at scale. The five steps give you the process. The seven capabilities give you the evaluation criteria. A Gartner analysis of CHRO priorities for 2026 found that shaping work in the human-machine era and building “now-next” talent strategies are top-tier concerns.
A workforce forecast that survives a CFO challenge, runs against actuals continuously, and produces Board-ready scenarios in hours is how HR delivers on those priorities.
Book a demo to see how ZingHR’s HCM platform serves your enterprise.
Frequently asked questions (FAQs)
Business-Finance alignment, a clean data foundation, demand forecasting by role and skill, supply forecasting with attrition and mobility modelled in, and scenario planning under governance. These map to the five steps above.
Labour forecasting covers shift-level scheduling at the 0-3 month horizon. Workforce forecasting covers 3-18 months of role, skill, location, and cost planning, owned jointly by HR and Finance. Different disciplines, different tools.
HCM platforms with embedded analytics (such as ZingHR), workforce management tools for operational scheduling, and FP&A platforms for the Finance rollup. For 1,000+ employee enterprises, a unified HCM that feeds governed data into both HR and Finance workflows is typically the right answer. Evaluate against the seven capabilities in this guide.
Target ≤5% variance on headcount and ≤8% on fully-loaded cost at the quarterly horizon. Track accuracy as a KPI by function.
Monthly for actuals tracking. Quarterly for re-baselining. Weekly refreshes on attrition and active headcount for high-velocity workforces (QSR, Retail, BPO, frontline Healthcare).
You can align HR and Finance with shared assumptions on revenue per FTE, fully-loaded cost per FTE, and cost-per-hire ceilings, agreed before modelling. Joint monthly reviews and quarterly re-baselining. One system of record with role-based access and audit trails.
What to do next?
See ZingHR in Action
Join the 1,200+ enterprises that have replaced fragmented HR with one intelligent, future-ready platform. See ZingHR in 30 minutes.
Build the Organization You Want
Great HR drives retention, capability, and culture. ZingHR takes care of the operational layer so your people team owns the strategy.

Elevating Impact.
Defining Destiny
See how ZingHR's AI-powered Hire-to-ReHire platform frees your CPO to lead with purpose and deliver the outcomes your Board is watching for


ZingHR is the AI-powered Hire-to-ReHire platform built for one purpose to remove every transactional layer of HR from your organisation, permanently.